NHS diagnostic waits: a postcode gap
23 October 2026 · Source: NHS England, Table 4 (8 October 2026)
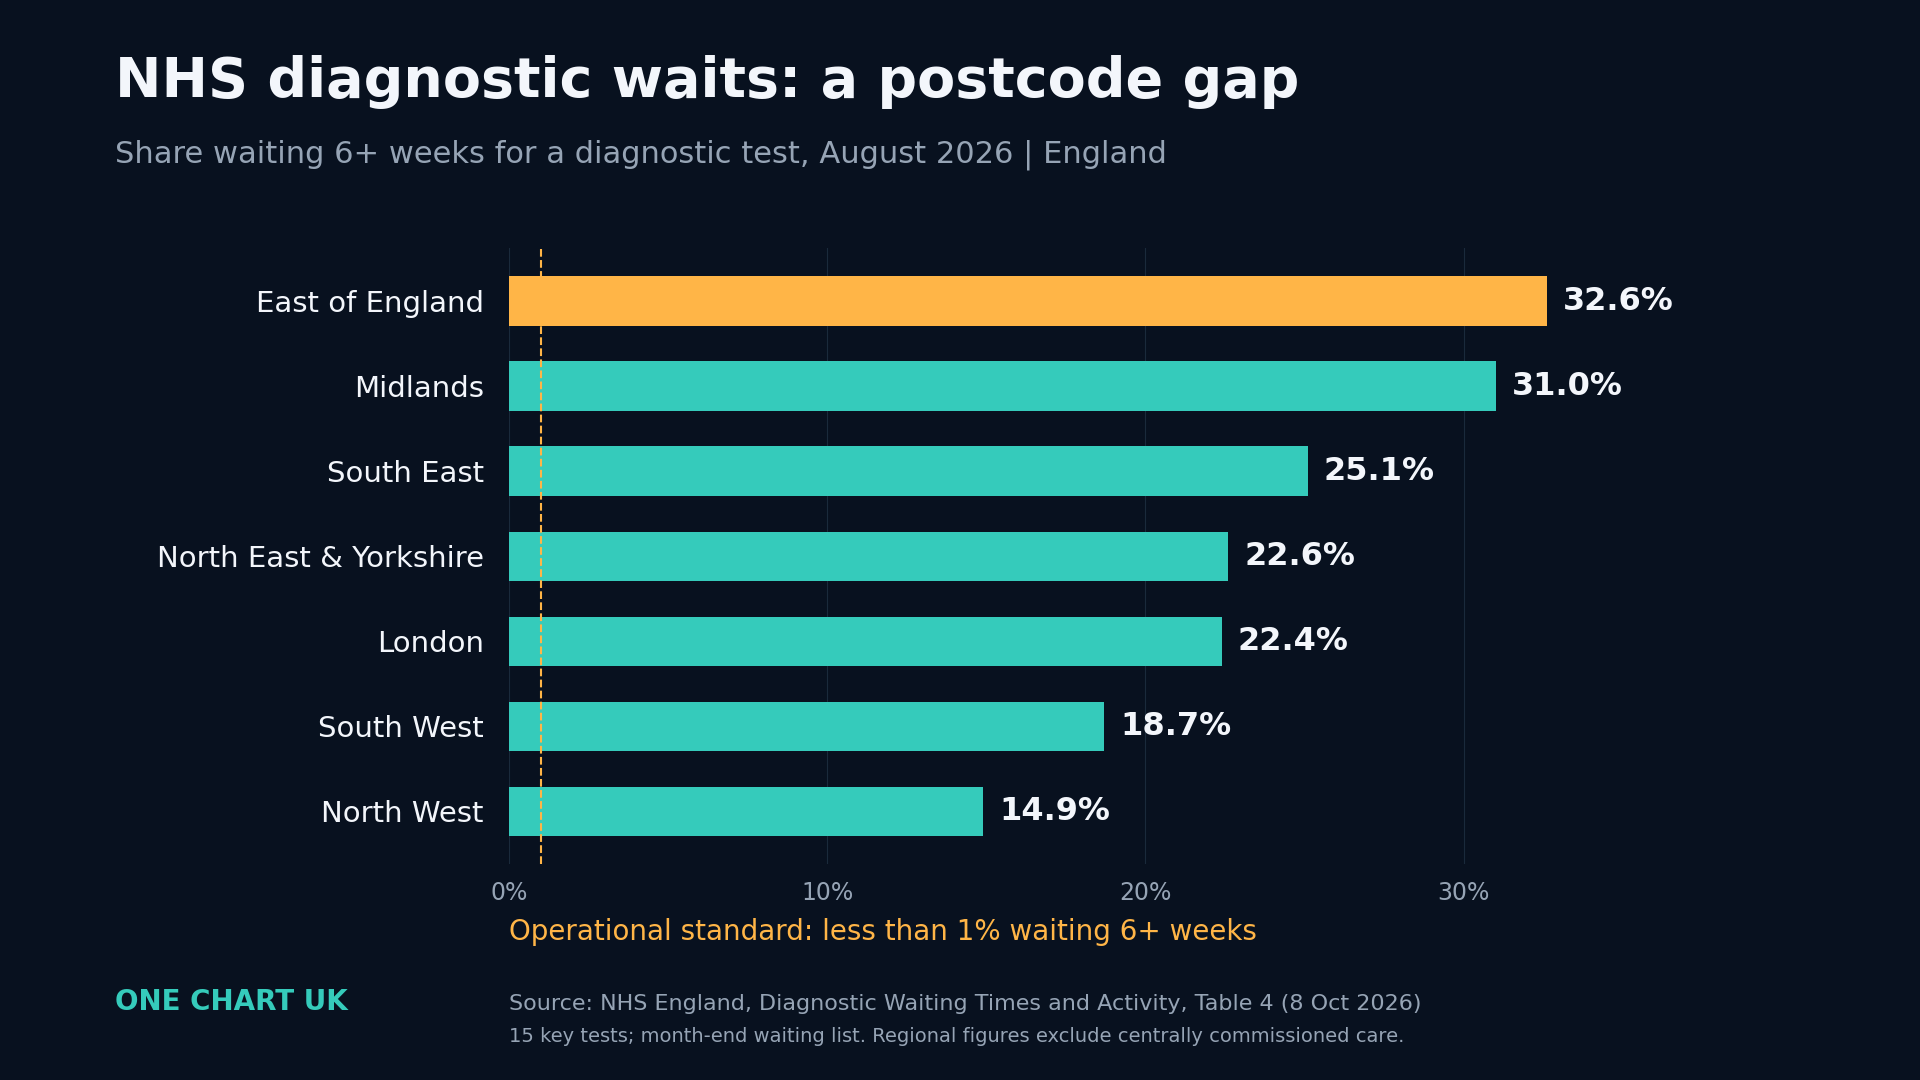
In August 2026, 32.6% of the East of England's NHS diagnostic waiting list had waited six weeks or more, compared with 14.9% in the North West. None of the seven regions met the operational standard of less than 1%. Figures cover 15 key tests and people still waiting at month-end, not completed tests. Regional totals include independent sector providers but exclude centrally commissioned care. Differences can reflect test mix, staffing and equipment, not just performance.
Every figure in this chart was read in the primary source before it was drawn.
← All charts