Rail revenue per journey, back to late-1990s levels
22 October 2026 · Source: Office of Rail and Road, Passenger rail usage, Table 1210 (published 1 October 2026)
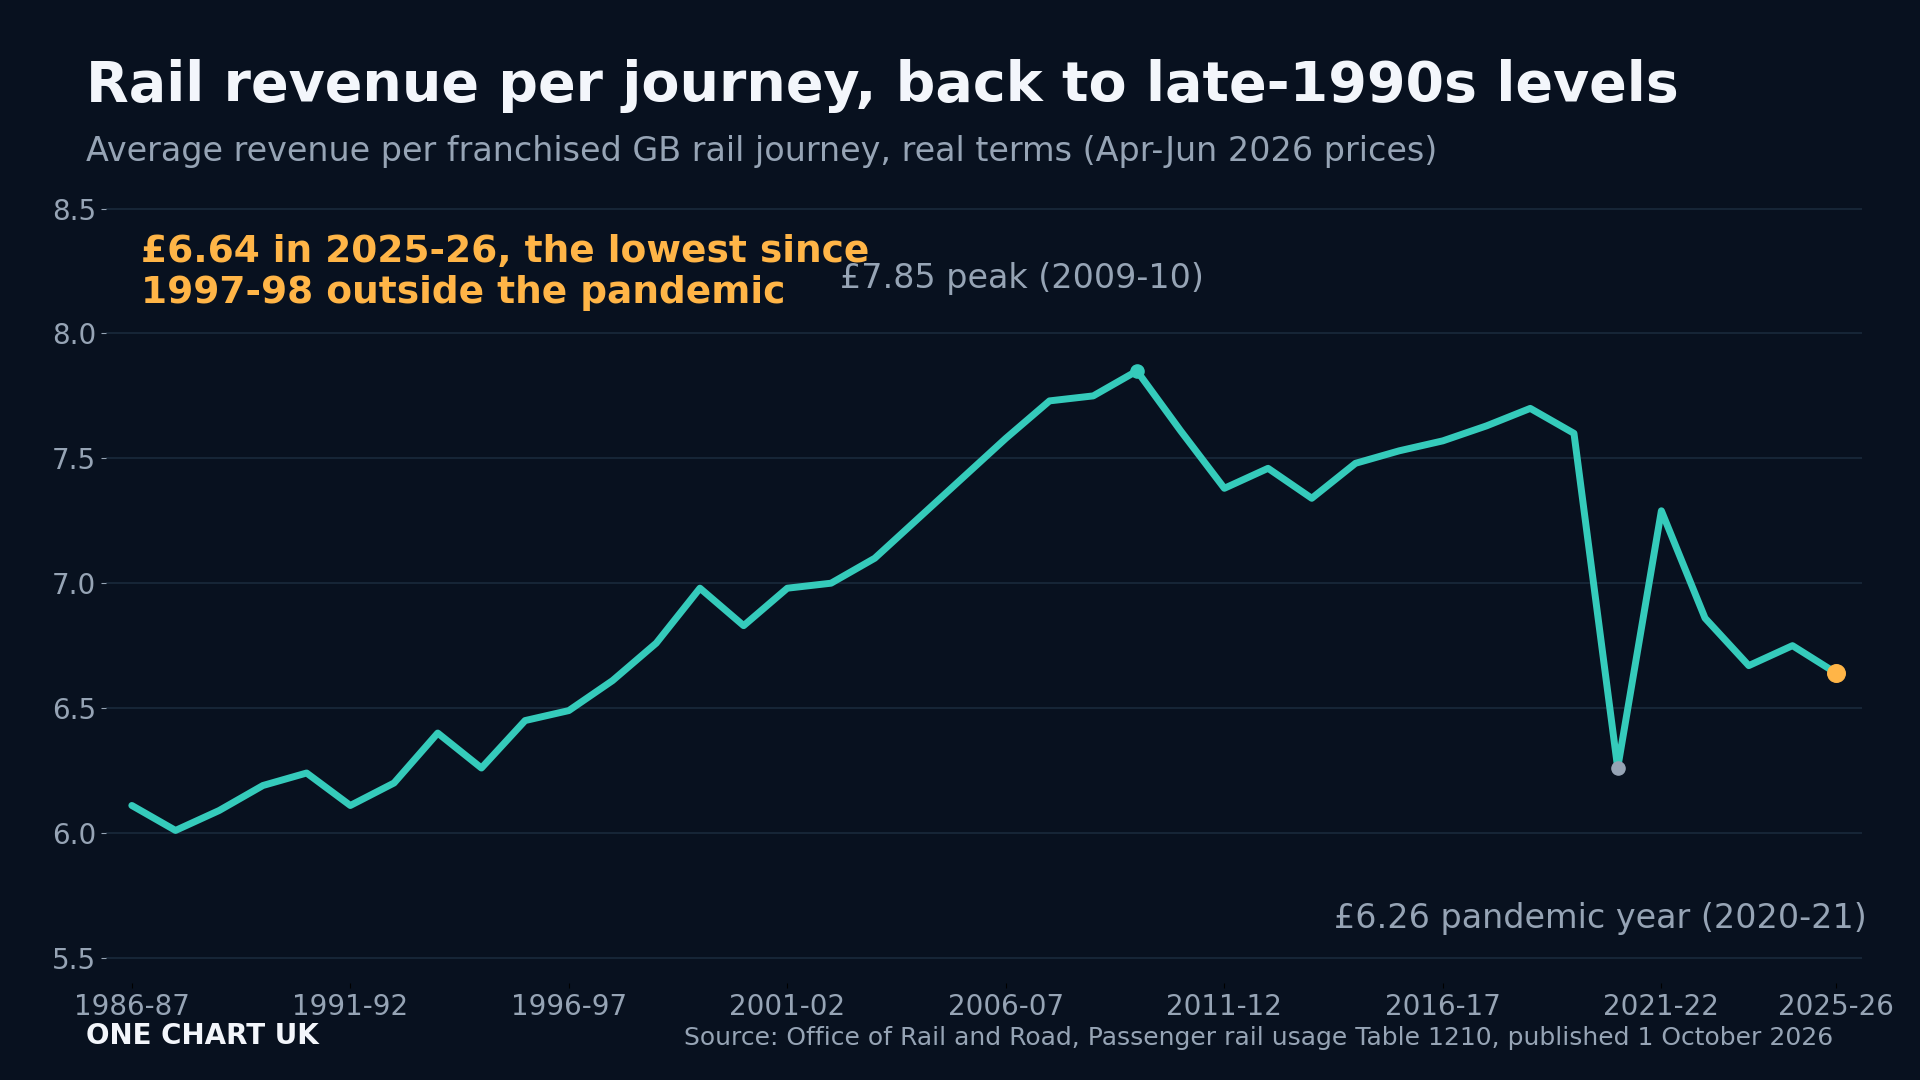
The average franchised GB rail journey brought in £6.64 in 2025-26, in today's prices (CPI-adjusted to April-June 2026) - the lowest since 1997-98 (£6.61) outside the pandemic year 2020-21 (£6.26). The peak was £7.85 in 2009-10. Averages cover franchised GB services only, excluding Eurostar, the Underground and light rail.
Every figure in this chart was read in the primary source before it was drawn.
← All charts