UK debt passes £3 trillion for the first time
21 October 2026 · Source: ONS, Public sector finances, UK: September 2026
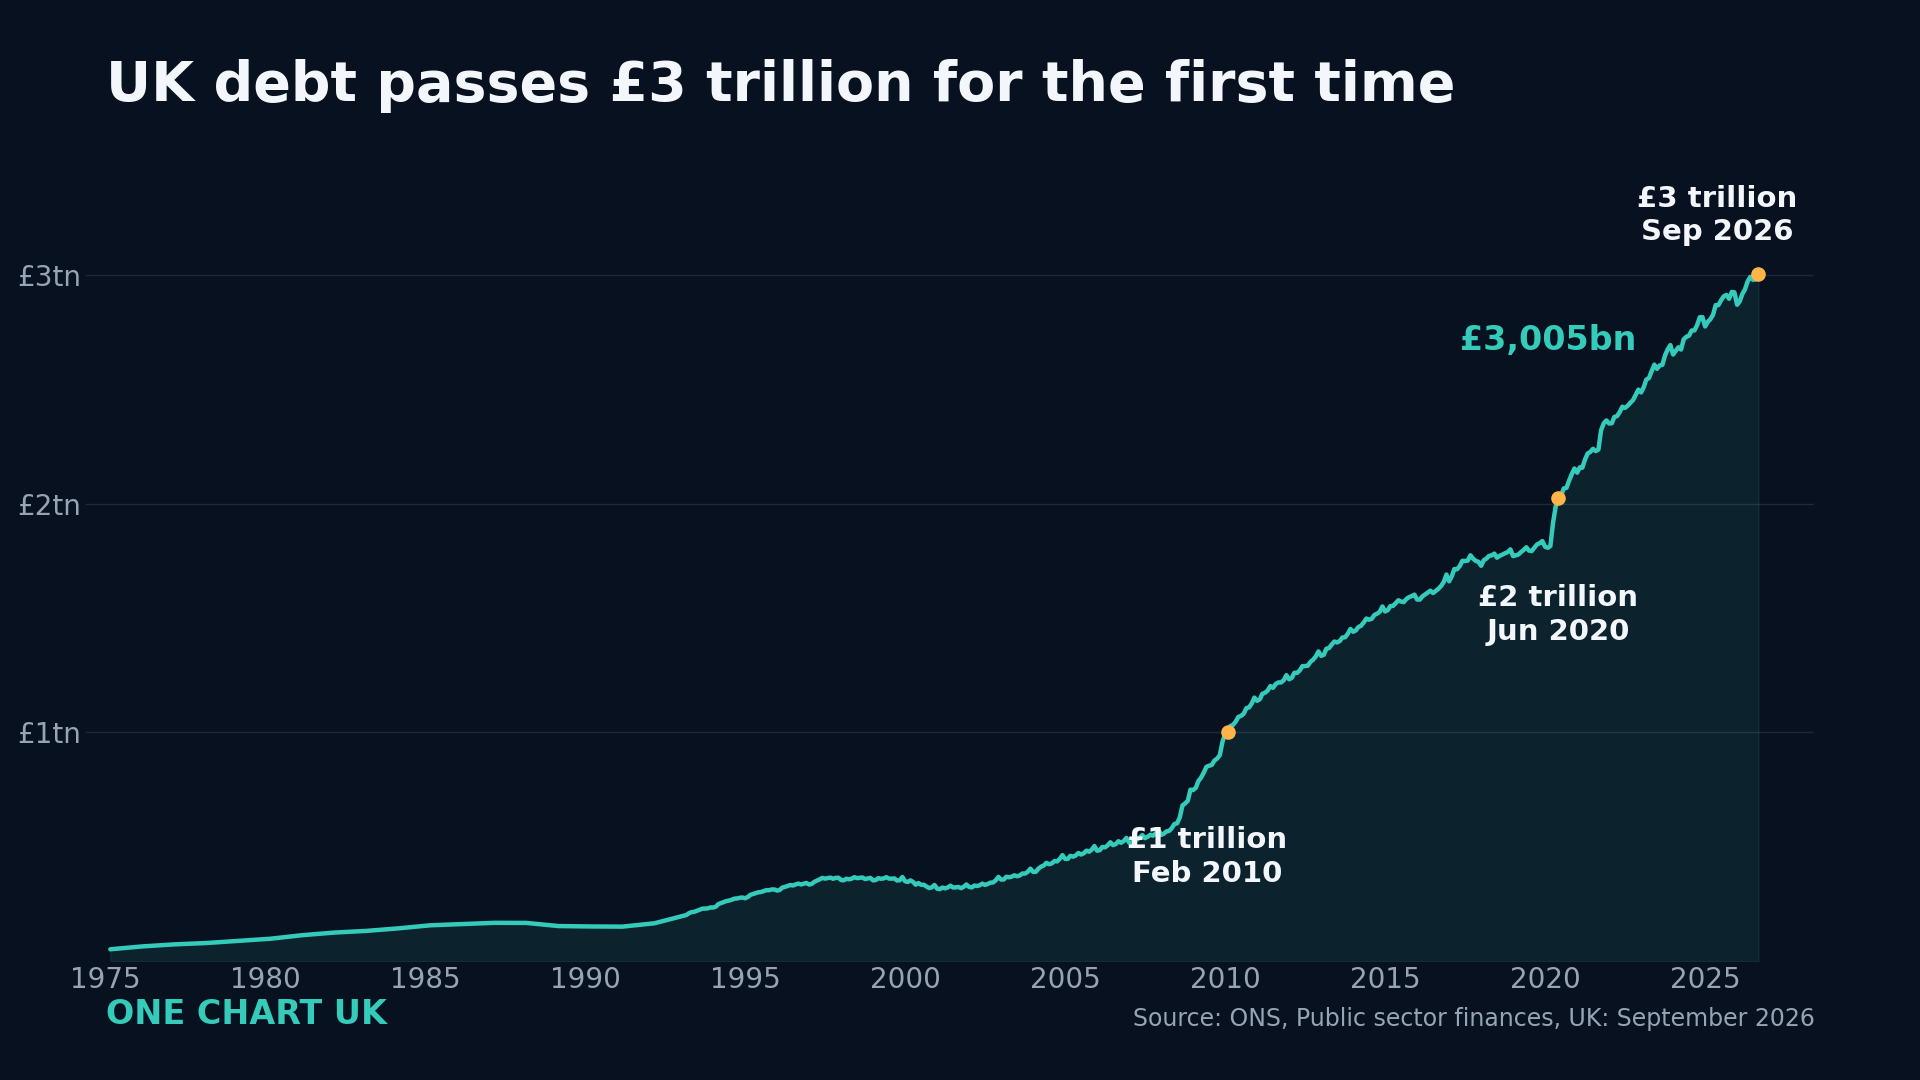
Public sector net debt reached £3,005 billion in September 2026, the first time above £3 trillion. The series passed £1 trillion in February 2010 and £2 trillion in June 2020.
Every figure in this chart was read in the primary source before it was drawn.
← All charts